Profiling Guide
To maximize the performance of vLLM RBLN, it is essential to perform low-level profiling that allows for an in-depth analysis of RBLN NPU behavior, in addition to monitoring standard metrics such as TTFT (Time To First Token) and TPOT (Time Per Output Token).
This document provides profiling guides for two types: PyTorch-Level Profiler and RBLN Profiler.
1. PyTorch-Level Profiler
This method uses the PyTorch Profiler to measure performance at the operation level. It allows for the analysis of kernel execution times and computational bottlenecks. vLLM RBLN supports the same interface as the official vLLM Profiling guide.
Note
Previously, profiling was configured using environment variables, but environment variables for profiling are starting to be deprecated. Starting from vLLM RBLN v0.10.1, profiling configuration is now set as parameters of the LLM.
1.1 Offline Inference Profiling
For offline inference using Python scripts, set up the profiling parameters to LLM and
use the start_profile() and stop_profile() methods to wrap the section you wish to measure.
1.2 Online Inference Profiling
For online inference via the API server, run the OpenAI server with the --profiler-config option:
Then, specific endpoints are called to control profiling.
- Call the
/start_profileendpoint to begin profiling. - Send the actual inference request (e.g.,
/v1/chat/completions). - Call the
/stop_profileendpoint to stop profiling and save the results.
1.3 Additional Options
For more detailed analysis, you can configure the following additional variables to profiler_config:
torch_profiler_record_shapes: Records tensor shape information, off by default.torch_profiler_with_memory: Profiles memory usage as well, off by default.torch_profiler_with_stack: Records source code stack traces, on by default.torch_profiler_with_flops: Records FLOPs (Floating Point Operations), off by default.torch_profiler_use_gzip: Controls gzip-compressing profiling files, on by default.
1.4 Visualizing Profiling Results
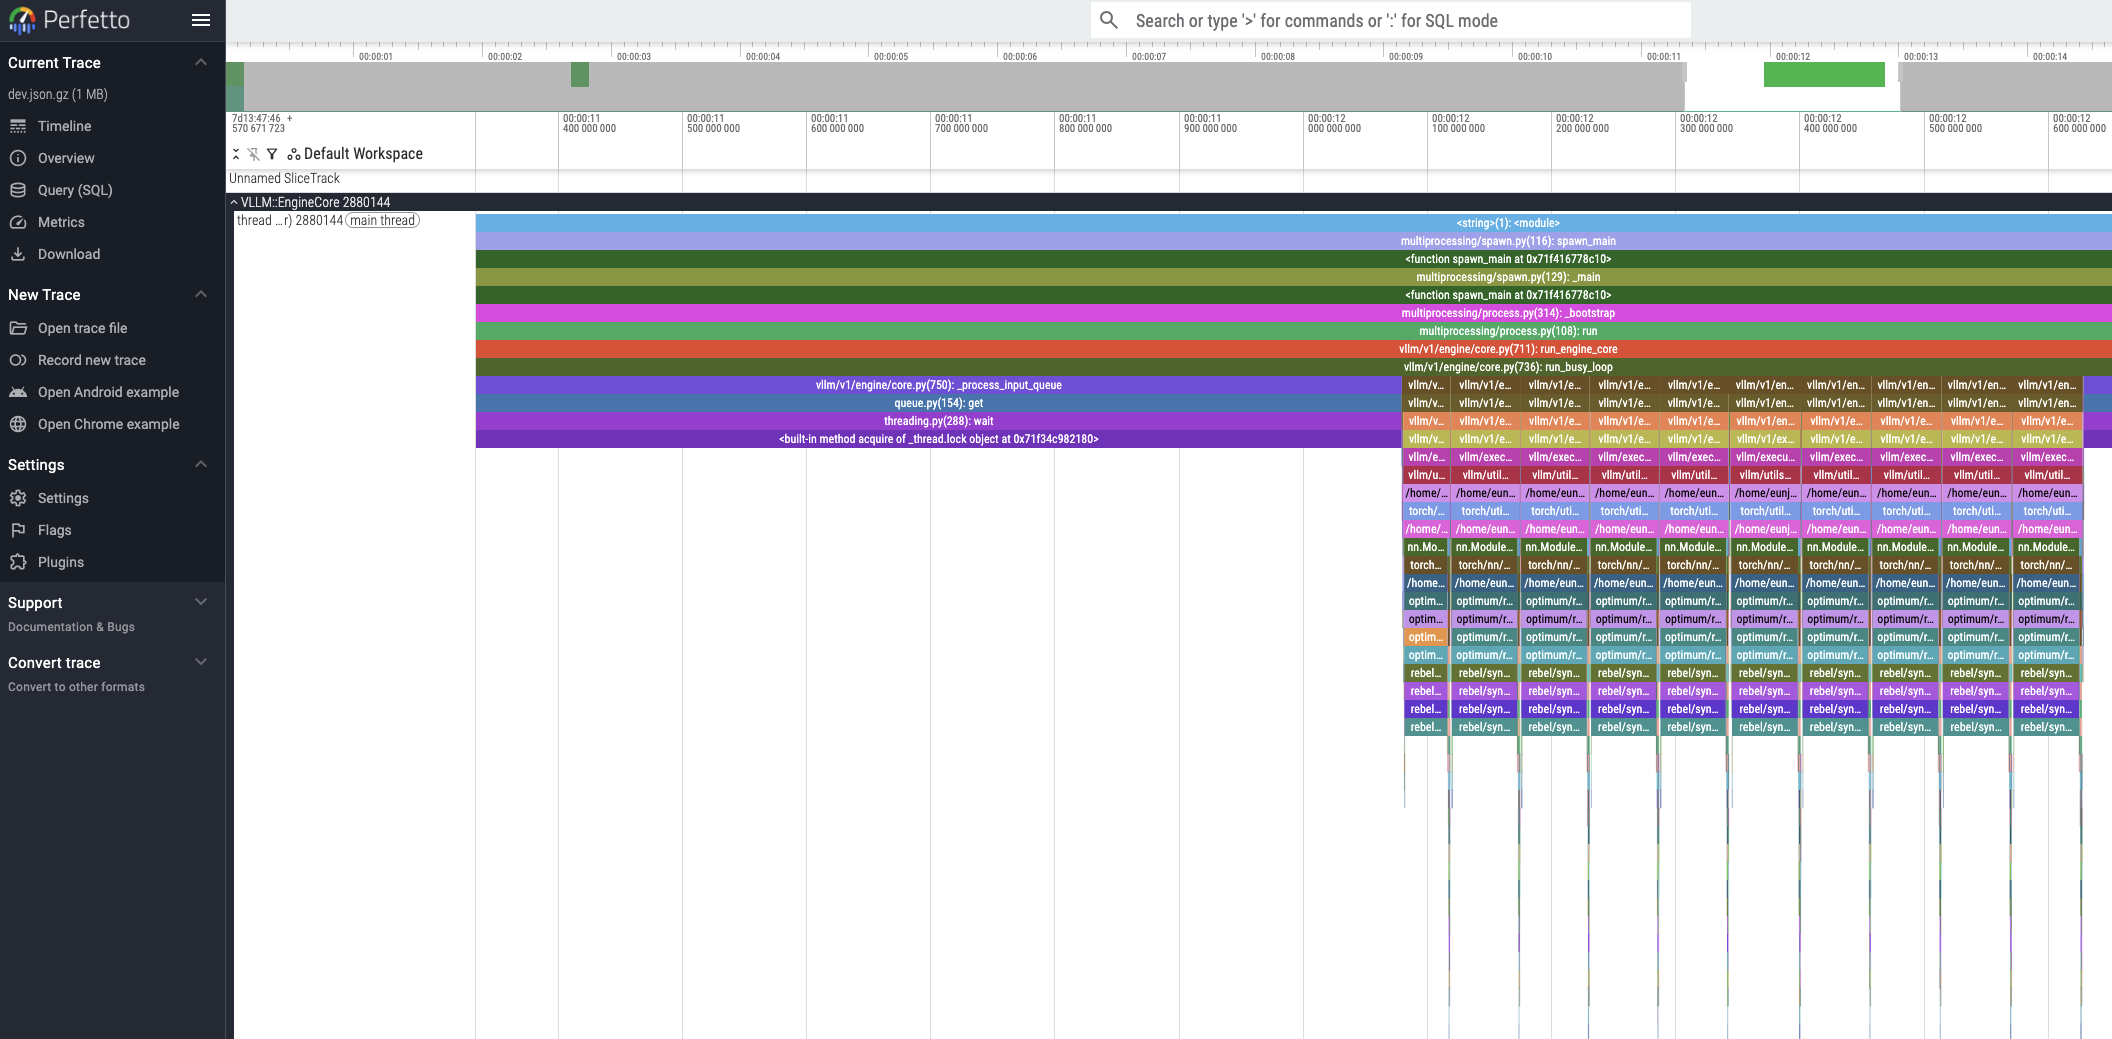
The generated profiling trace files can be visualized using the Perfetto UI.
2. RBLN Profiler
The RBLN Profiler is a software tool designed for in-depth performance analysis of workloads running on RBLN NPUs. For more details about RBLN Profiler, please refer to RBLN Profiler
2.1 Constraints and Configuration
In the vLLM RBLN environment, profiling with the RBLN Profiler is supported only when the multiprocessing configuration is disabled. Support for profiling with multiprocessing enabled will be included in an upcoming release.
Set the environment variables as shown below and run vLLM to generate profiling results.
RBLN_PROFILER=1: Enables the RBLN Profiler.VLLM_ENABLE_V1_MULTIPROCESSING=0: Disables multiprocessing.
2.2 Visualizing Profiling Results
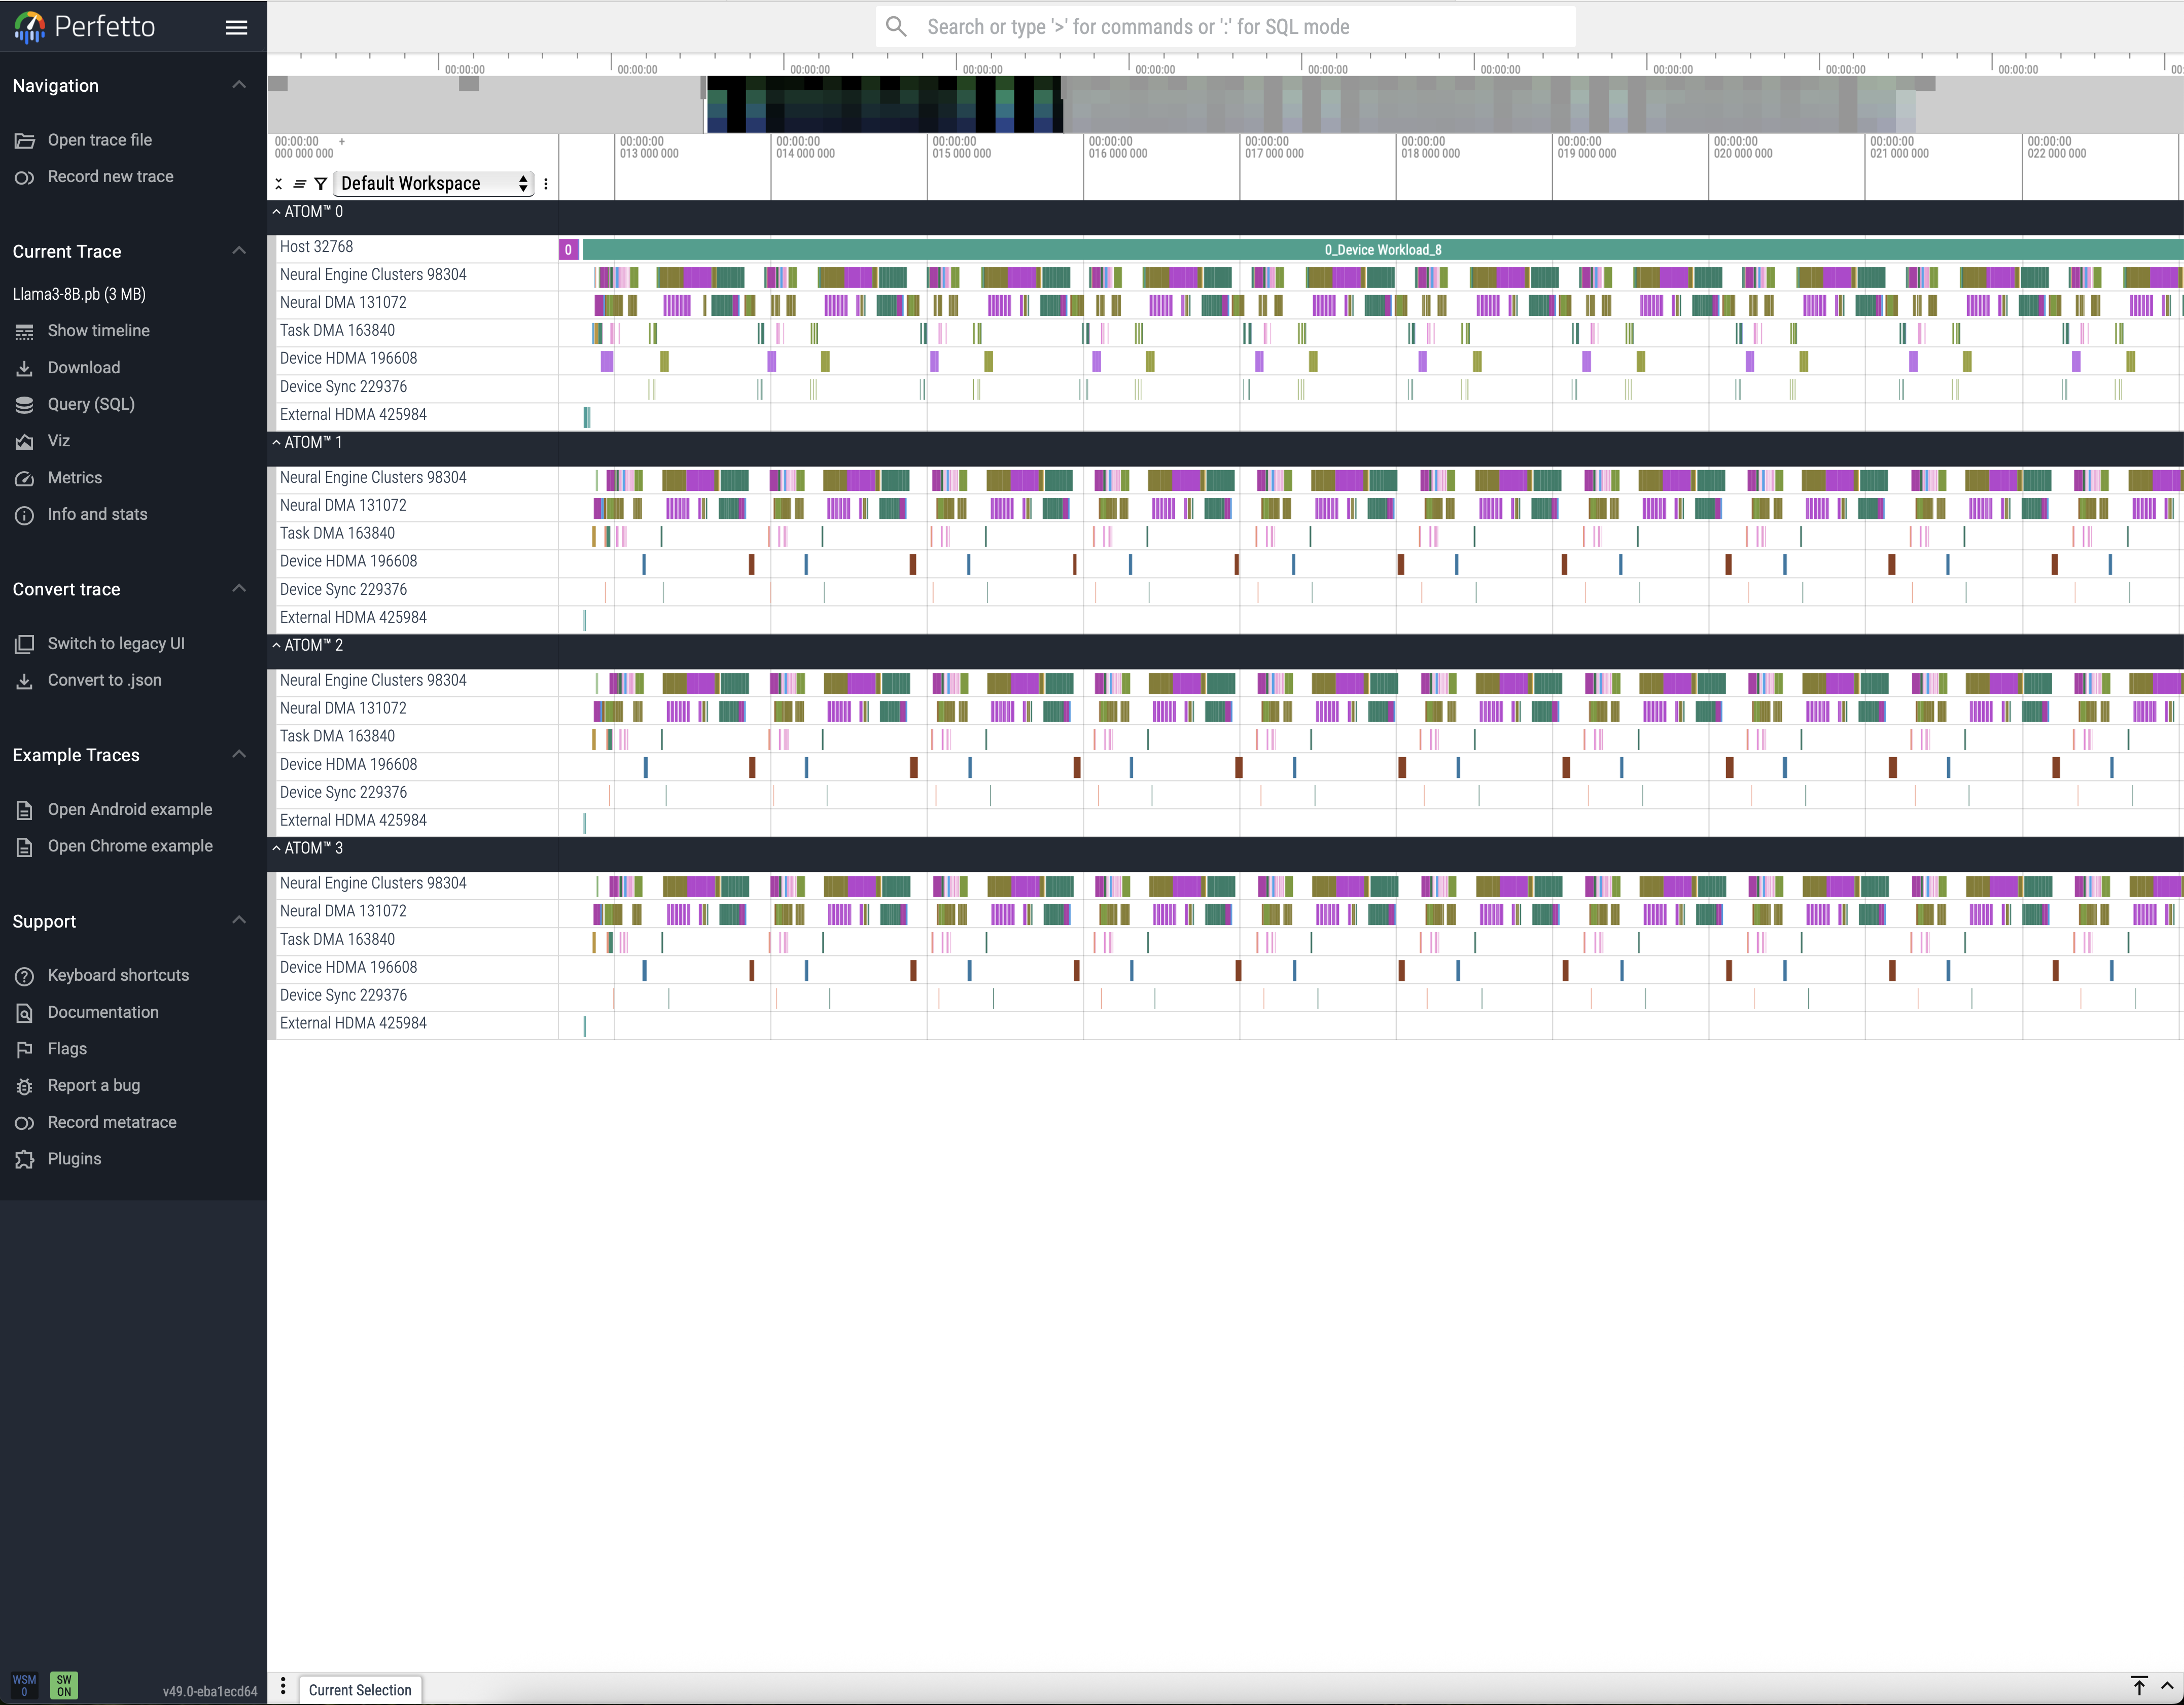
The resulting profiling trace files can also be visualized using the Perfetto UI. For more details on trace analysis, please refer to the Perfetto Analysis Guide.