RBLN Profiler
The RBLN Profiler is a software tool designed for in-depth performance analysis of workloads running on RBLN NPUs. It offers insights into resource utilization and identifies areas for optimization. The tool monitors key metrics such as memory footprint, command execution times, and performance bottlenecks. These insights enable users to fine-tune their workloads for optimal performance in production environments.
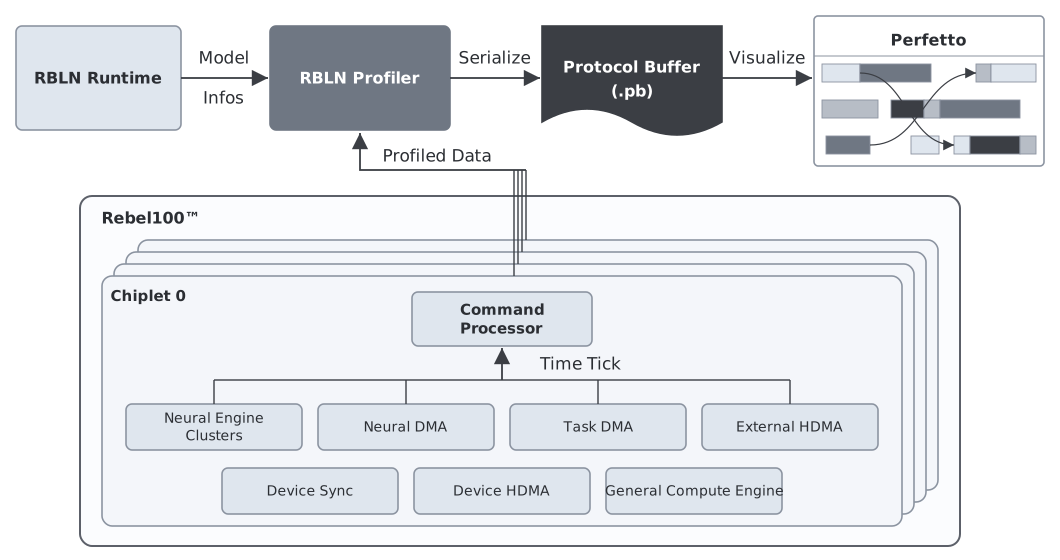
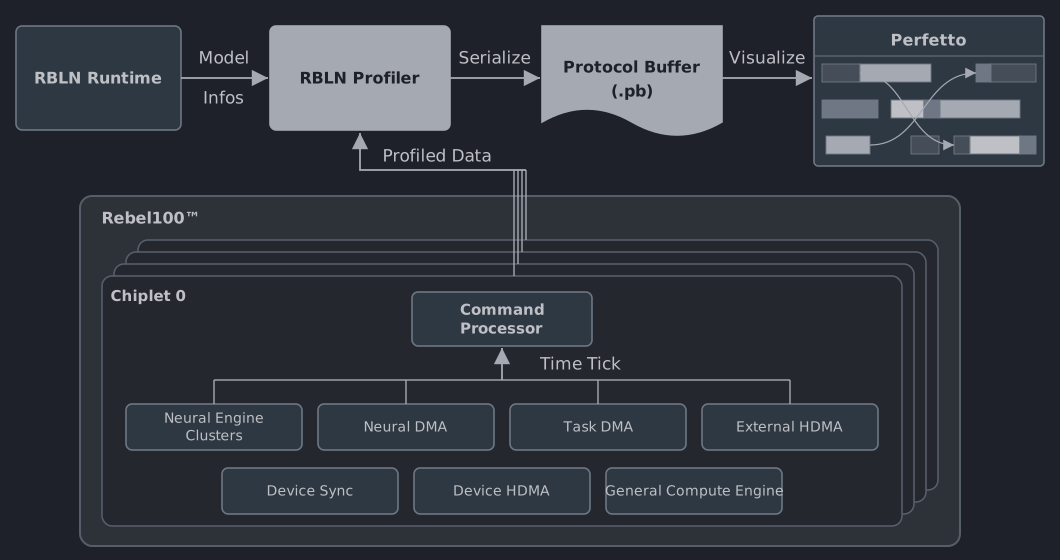
This flowchart illustrates the flow of profiling data from the RBLN Runtime environment through the RBLN Profiler and its visualization using Perfetto:
- RBLN Runtime provides model information to the RBLN Profiler for analysis.
- RBLN Profiler processes and breaks down the profiling data from the RBLN NPUs, then serializes it into a Protocol Buffer (.pb) format for analysis and visualization.
- Protocol Buffer (.pb) is processed and visualized by Perfetto, which displays execution timelines and dependencies.
- Rebel100™ provides the following commands:
- Neural Engine Clusters / Neural DMA / Task DMA / External HDMA / Device HDMA / Device Sync / General Compute Engine
The following resources provide a deeper understanding of the RBLN Profiler:
-
RBLN NPU Architecture explains the Rebel100™ architecture.
-
Profiling describes the profiling process using the RBLN Profiler.
-
Perfetto
- Introduction provides an overview of Perfetto and a brief guide on how to use it.
- How to Analyze explains how to analyze visualized results.
- Large Model Visualization shows how to visualize profiling results in a local environment.
- Merging Multiple Traces shows how to view several per-rank traces on one timeline.
-
Examples
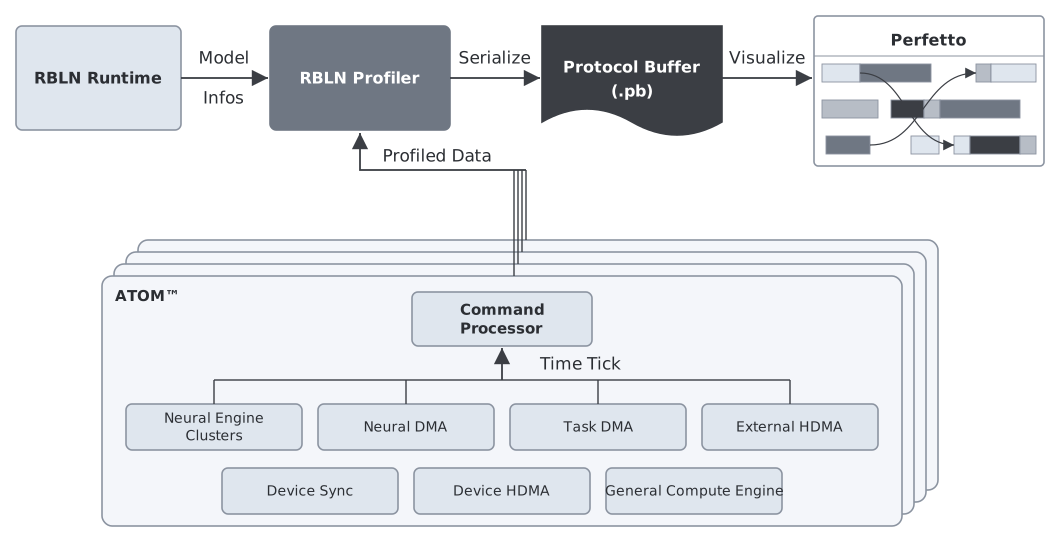
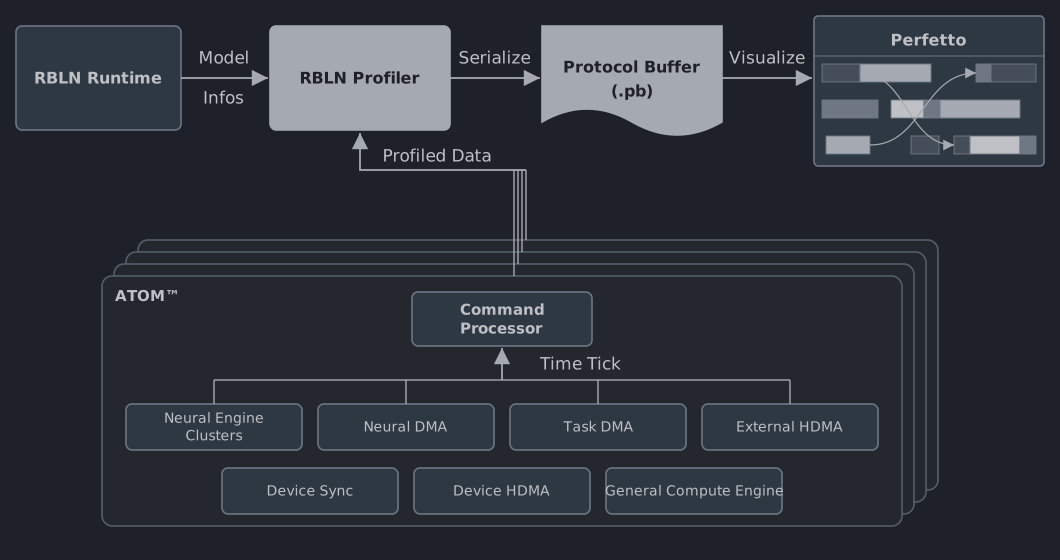
This flowchart illustrates the flow of profiling data from the RBLN Runtime environment through the RBLN Profiler and its visualization using Perfetto:
- RBLN Runtime provides model information to the RBLN Profiler for analysis.
- RBLN Profiler processes and breaks down the profiling data from the RBLN NPUs, then serializes it into a Protocol Buffer (.pb) format for analysis and visualization.
- Protocol Buffer (.pb) is processed and visualized by Perfetto, which displays execution timelines and dependencies.
- ATOM™ provides the following commands:
- Neural Engine Clusters / Neural DMA / Task DMA / External HDMA / Device HDMA / Device Sync / General Compute Engine
The following resources provide a deeper understanding of the RBLN Profiler:
-
RBLN NPU Architecture explains the ATOM™ architecture.
-
Profiling describes the profiling process using the RBLN Profiler.
-
Perfetto
- Introduction provides an overview of Perfetto and a brief guide on how to use it.
- How to Analyze explains how to analyze visualized results.
- Large Model Visualization shows how to visualize profiling results in a local environment.
- Merging Multiple Traces shows how to view several per-rank traces on one timeline.
-
Examples