Qwen3-1.7B (Text Generation)
This case study runs Qwen3-1.7B with RBLN Optimum and uses the RBLN Profiler to analyze computation distributed across the chiplets of a Rebel100™ device.
Rebel100™ is a chiplet-based SoC in which four homogeneous chiplets operate as one device. A model's computation is divided across those four chiplets, and the trace shows them as the Chiplet 0 to Chiplet 3 groups under a single device. A divided operation appears as slices carrying the same operation name in each of the four groups, and each chiplet's Neural DMA track shows the transfer of the weights assigned to that chiplet.
A model large enough that ATOM™ spreads it across four NPUs with RSD runs on Rebel100™'s four chiplets, which are packaged together. The chiplets are joined by die-to-die links, so the split never crosses a device boundary, and the trace shows one device with the chiplet groups under it. For an ATOM™ trace, see Llama3-8B (Text Generation).
Enabling the RBLN Profiler works the same way as on ATOM™: the same RBLN_PROFILER=1 environment variable or the same rbln_activate_profiler=True argument. The profiling data also comes out in the same format.
Preliminaries
Installation
Install optimum-rbln by following RBLN Optimum Installation.
Compile Model and Activate RBLN Profiler
The following example runs Qwen3-1.7B on one Rebel100™ device and records profiling data. rbln_activate_profiler=True enables the RBLN Profiler:
The profiler can also be enabled through the environment variable instead of editing the code. In that case, drop rbln_activate_profiler=True:
Note
Both forms are documented on the Profiling page. No additional profiler-specific settings are required for Rebel100™.
Extract Profiled Data with Inference
Run inference to obtain profiling data:
Once the inference finishes, the traces are left in the current directory:
The file without a numeric suffix holds every execution, so it can be opened alone with nothing to merge.
with profile(...) profiles only the section of code it wraps:
Analysis of Profiled Data from Qwen3-1.7B with RBLN Profiler
Profiling Result
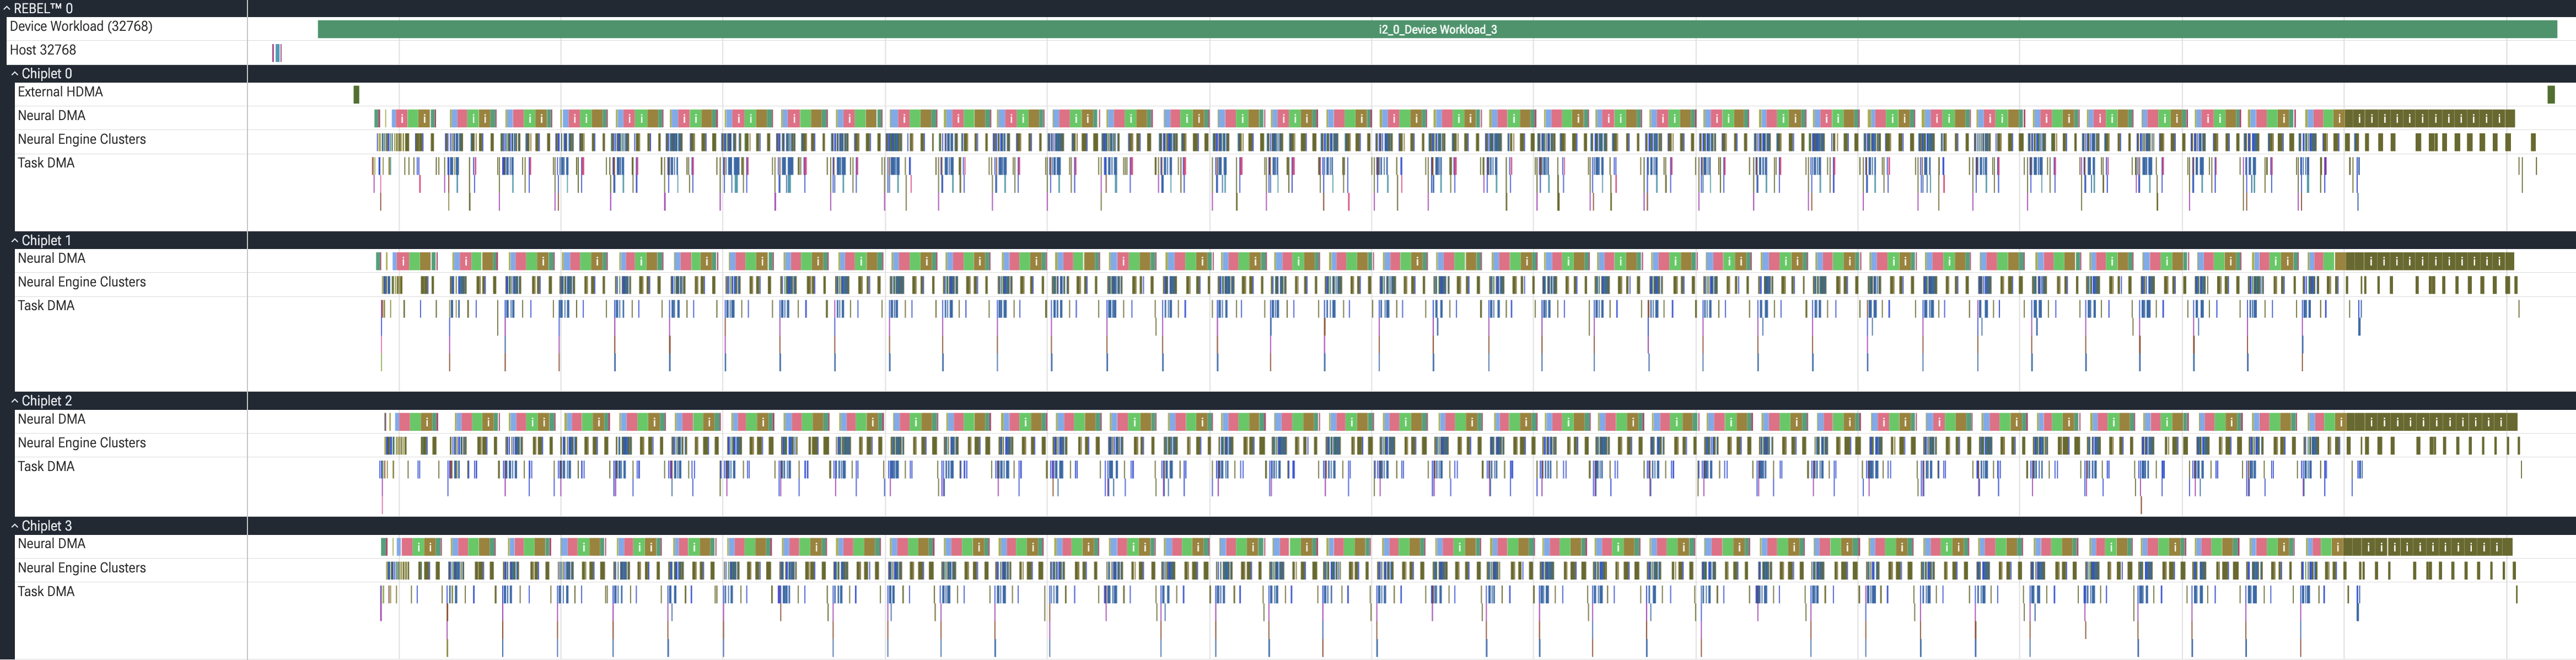
A command is recorded under the Chiplet group of the chiplet that ran it. Each group holds the Neural Engine Clusters, Neural DMA, Task DMA, External HDMA, Device HDMA, Device Sync, and General Compute Engine command tracks, and only the tracks that carry commands are shown.
The Device Workload track holds i{instance_index}_{sequence_index}_Device Workload_{workload_index} slices, and the commands belonging to one of those slices carry the matching i{instance_index}_{sequence_index}_W{workload_index} prefix in their names. Search for that prefix to collect the commands the four chiplets ran for that slice. Where one module runs several times, W{workload_index} alone does not separate the runs, so search on the whole prefix. The naming convention is described in How to Analyze.
An operation that the RBLN Compiler divided across chiplets shows the same operation name in several Chiplet groups. The command index at the end of the name differs from chiplet to chiplet.
Note
ATOM™ is a single-die SoC, so an ATOM™ trace has no Chiplet groups — its command tracks sit directly under the device group.
Computation Distributed across Chiplets
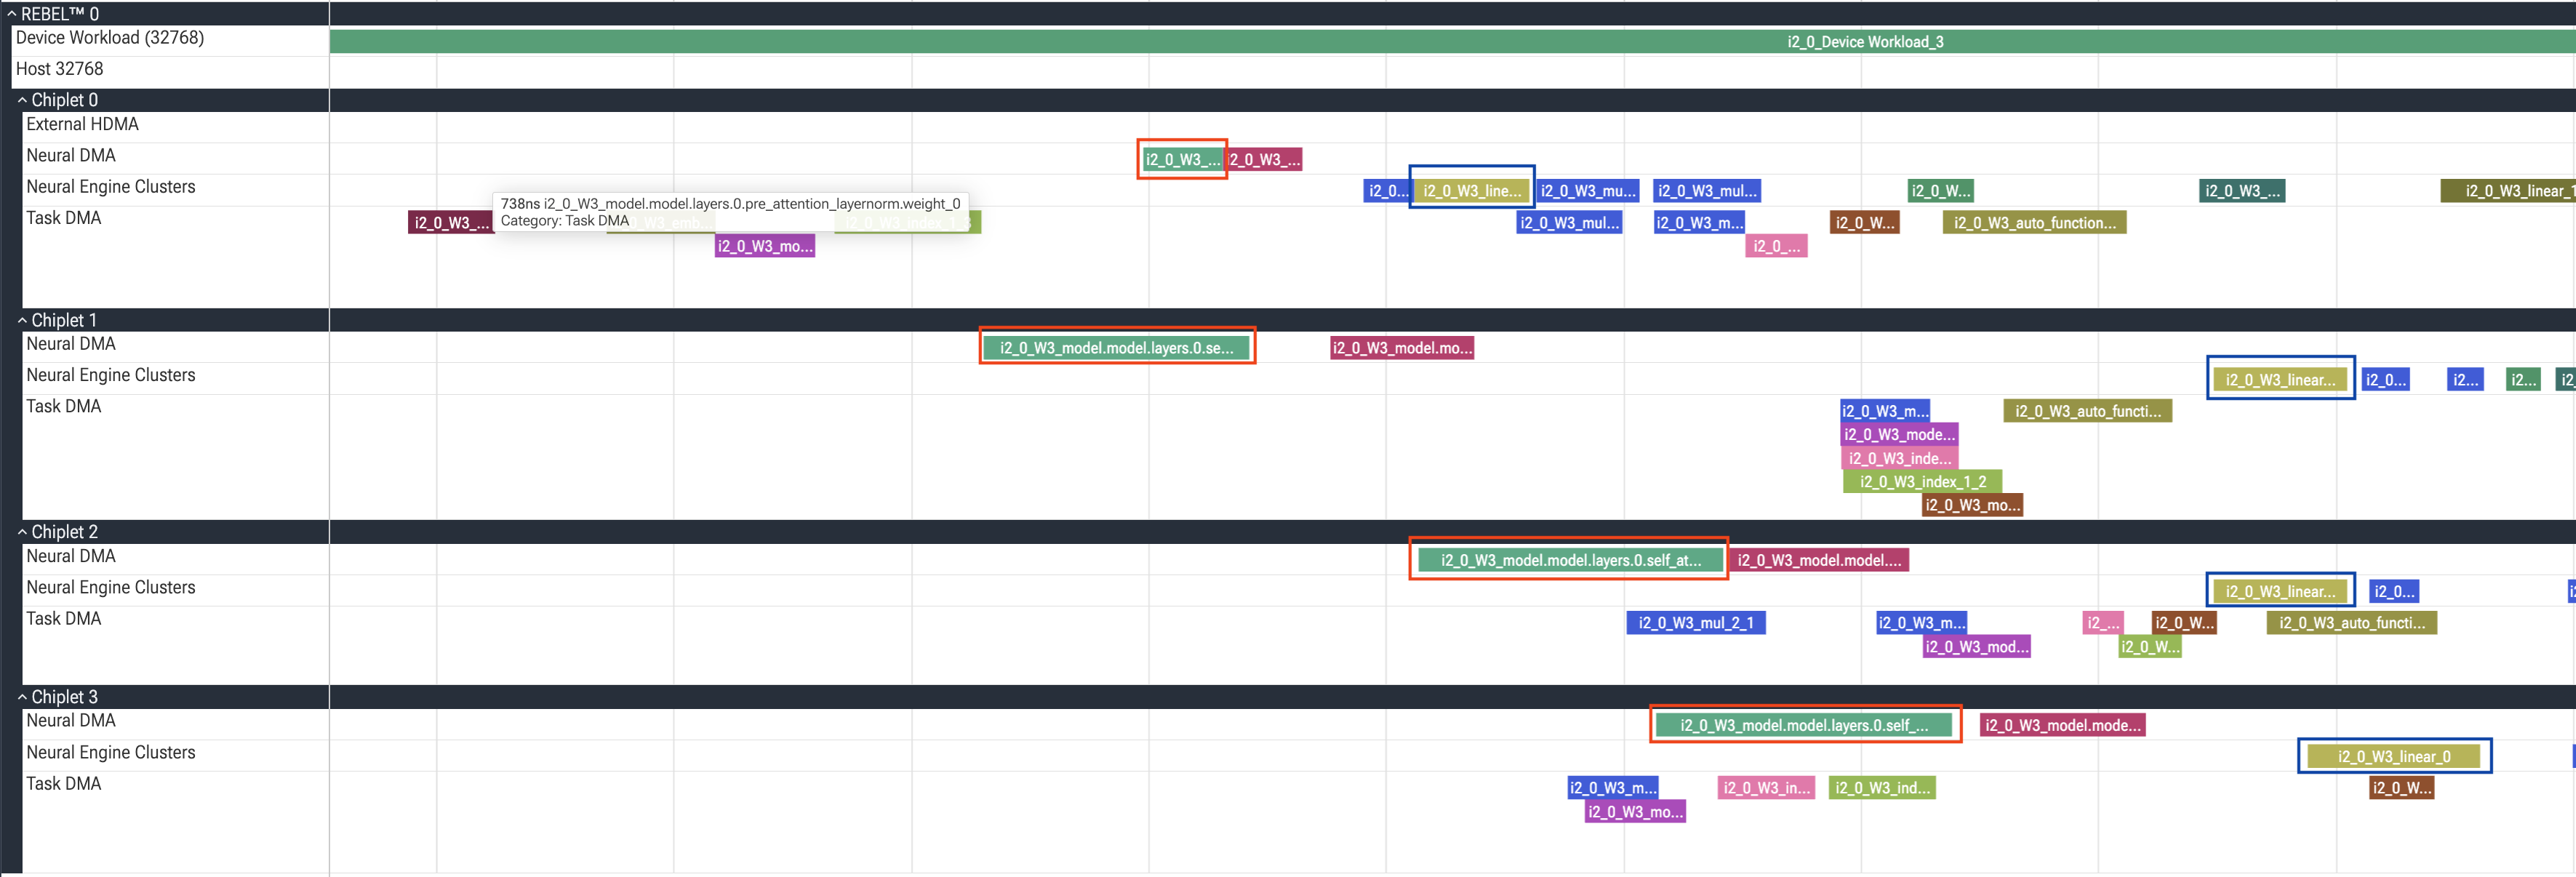
How a single operation is divided across the four chiplets is easiest to follow through q_proj, the first computation of attention in Qwen3-1.7B. The q_proj weights of the first layer are divided across the four chiplets: the Neural DMA tracks of Chiplet 0 through Chiplet 3 each hold one slice whose name contains model.model.layers.0.self_attn.q_proj.weight. The name of a weight slice states which parameter of the model it holds, and the Chiplet group it sits in shows which chiplet took that share.
On the Neural Engine Clusters track, each chiplet then runs the linear computation that uses its share of those weights.
Not every parameter is divided. The pre_attention_layernorm weight of the same layer appears only on the Task DMA track of Chiplet 0.
Output Data Transfer
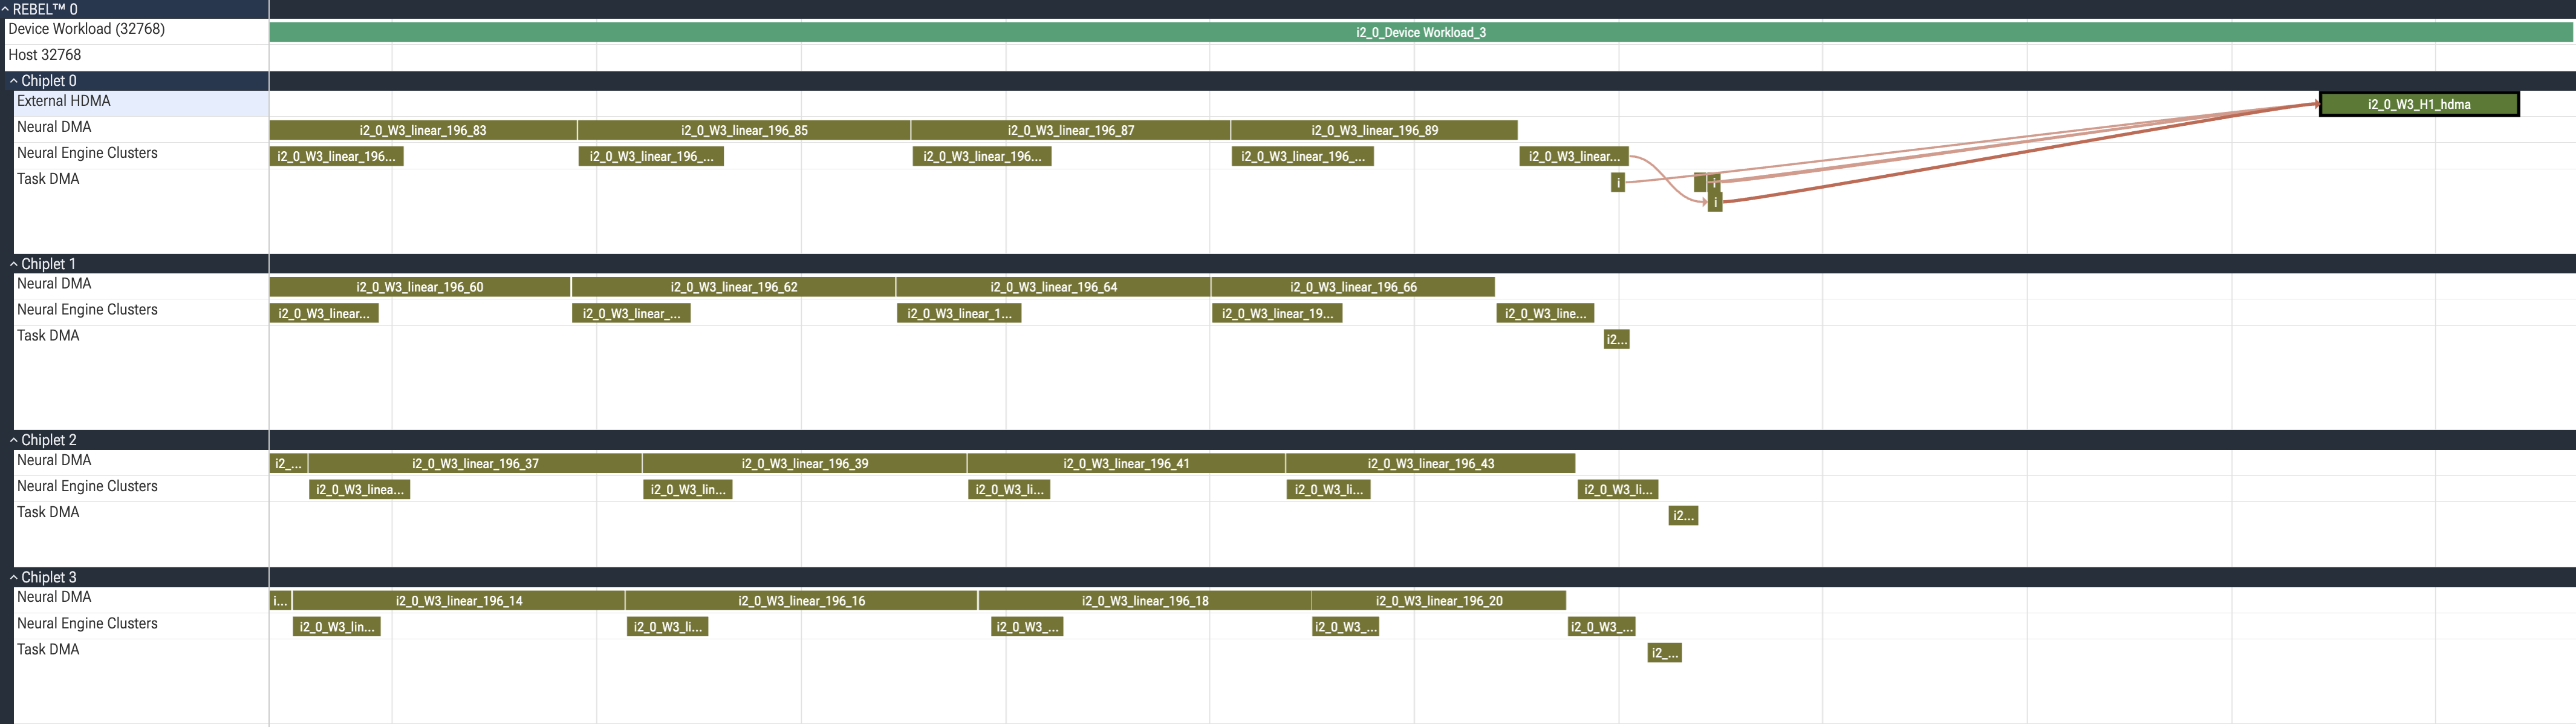
The model's final computation is divided across the four chiplets as well, but the External HDMA that sends the result back to the host exists only on Chiplet 0. At the end of the trace, the commands on Chiplet 1 through Chiplet 3 finish first. Chiplet 0 then completes the remaining Task DMA transfers and sends the result to the host through a single External HDMA transfer.
Perfetto's flow arrows make this visible. Selecting the External HDMA slice also draws the arrows arriving from several slices on the same chiplet's Task DMA, showing several pieces converging into one transfer. The input travels the same track: selecting the External HDMA slice at the head of the workload draws an arrow out to the embedding slice on Task DMA.
References
- RBLN Profiler
- Analyzing profiler data with Perfetto
- Other profiling examples: gpt-oss-20b, gpt-oss-20b (Data Parallelism)