gpt-oss-20b
This case study runs gpt-oss-20b with RBLN vLLM and uses the RBLN Profiler to analyze its execution on Rebel100™.
As in the Qwen3-1.7B (Text Generation) case study, RBLN_PROFILER=1 enables the profiler. In this case, the vLLM engine manages model execution, so start_profile() and stop_profile() define the profiling range.
This page covers the simplest configuration: a run on one Rebel100™ device. A trace is written per worker process (rank), so a single-rank run produces a single trace — the clearest form in which to see how the framework's execution maps onto the device.
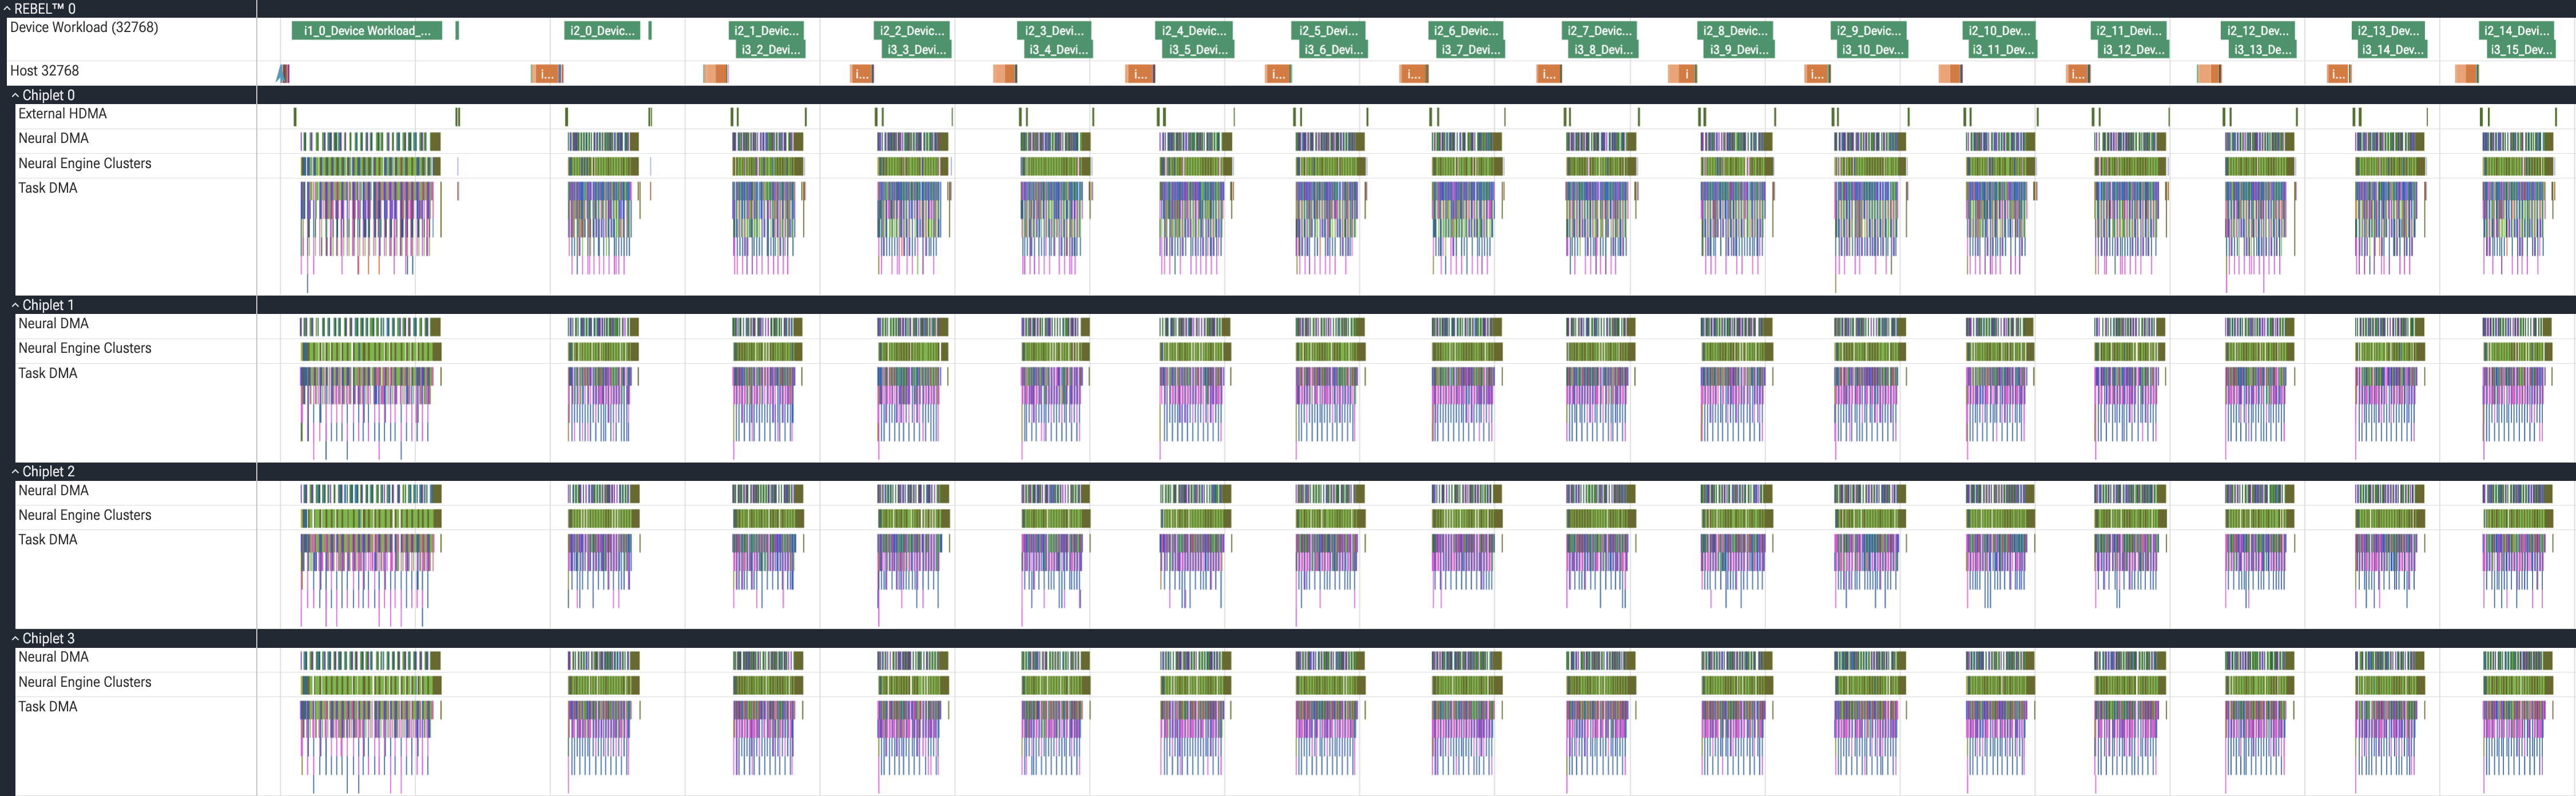
Unlike a conventional model that returns its result in one shot, an LLM answers one inference request through many model executions. For the best performance a serving framework may dispatch several distinct compiled models — the decoder, the sampler — asynchronously. This page profiles such a run as a whole: many decode steps, executed asynchronously.
Preliminaries
Installation
Install vllm-rbln as described in RBLN vLLM. The example scripts on this page live under examples/ in the vllm-rbln repository, so following the source-code install leaves them in place as well.
Activate RBLN Profiler
Setting RBLN_PROFILER=1 enables the RBLN Profiler.
No additional profiler-specific settings are required for Rebel100™.
Extract Profiled Data with Inference
See data_parallel_offline.py in vllm-rbln for an example of data-parallel execution. To profile a model, keep its execution settings and pass profiler_config when creating the LLM. After warm-up, use start_profile() and stop_profile() to mark the inference range.
The RBLN Profiler runs on the vllm model implementation, and model_impl="vllm" on LLM selects it.
--dp-size sets the data-parallel size. This page keeps it at 1; profiling a run split over several ranks is covered in gpt-oss-20b (Data Parallelism).
Which profiler start_profile() and stop_profile() control depends on the profiler_config setting.
- With
"profiler": "torch"as above: the PyTorch profiler opens and closes the session, and the RBLN trace is merged into its trace. See PyTorch Profiler Integration. - Run without
profiler_config: the path that drives the RBLN Profiler directly is selected, and the RBLN Profiler session starts and ends atstart_profile()andstop_profile().
stop_profile() returns after the trace has been written, so the *.pb file is on disk before the process exits.
When the run finishes, each of the two profilers writes its own output: the RBLN Profiler's traces go under a per-rank directory as .pb files, and the PyTorch profiler's chrometrace goes to the directory named by torch_profiler_dir.
That chrometrace holds not only the framework operations but also the device slices the RBLN Profiler collected. The same run therefore produces both a .pb that holds the device side alone and a chrometrace that holds the framework and the device together. Open the .pb to look at device execution by itself, and the chrometrace to look at it alongside the framework calls — which is what PyTorch Profiler Integration covers.
Warning
Without start_profile() and stop_profile() marking the profiling range, the trace can be lost. In a multi-process configuration the workers run in their own processes and are torn down when the engine shuts down; any trace data that has not been written to disk by then is lost. stop_profile() returns only after every worker has finished writing, so wrap the profiling range with start_profile() and stop_profile() as vLLM's profiling usage prescribes.
Tip
To see the framework operations as well, pass profiler_config to LLM to enable the PyTorch profiler alongside the RBLN Profiler. The device slices the RBLN Profiler collects are merged into the PyTorch profiler's chrometrace, putting the framework operations and the device execution on one screen.
This merge is supported on Rebel100™ only; it is not available on ATOM™. The configuration and its behavior are described in the Profiling Guide.
Analysis of Profiled Data from gpt-oss-20b with RBLN Profiler
Asynchronous Dispatch of Decoder and Sampler
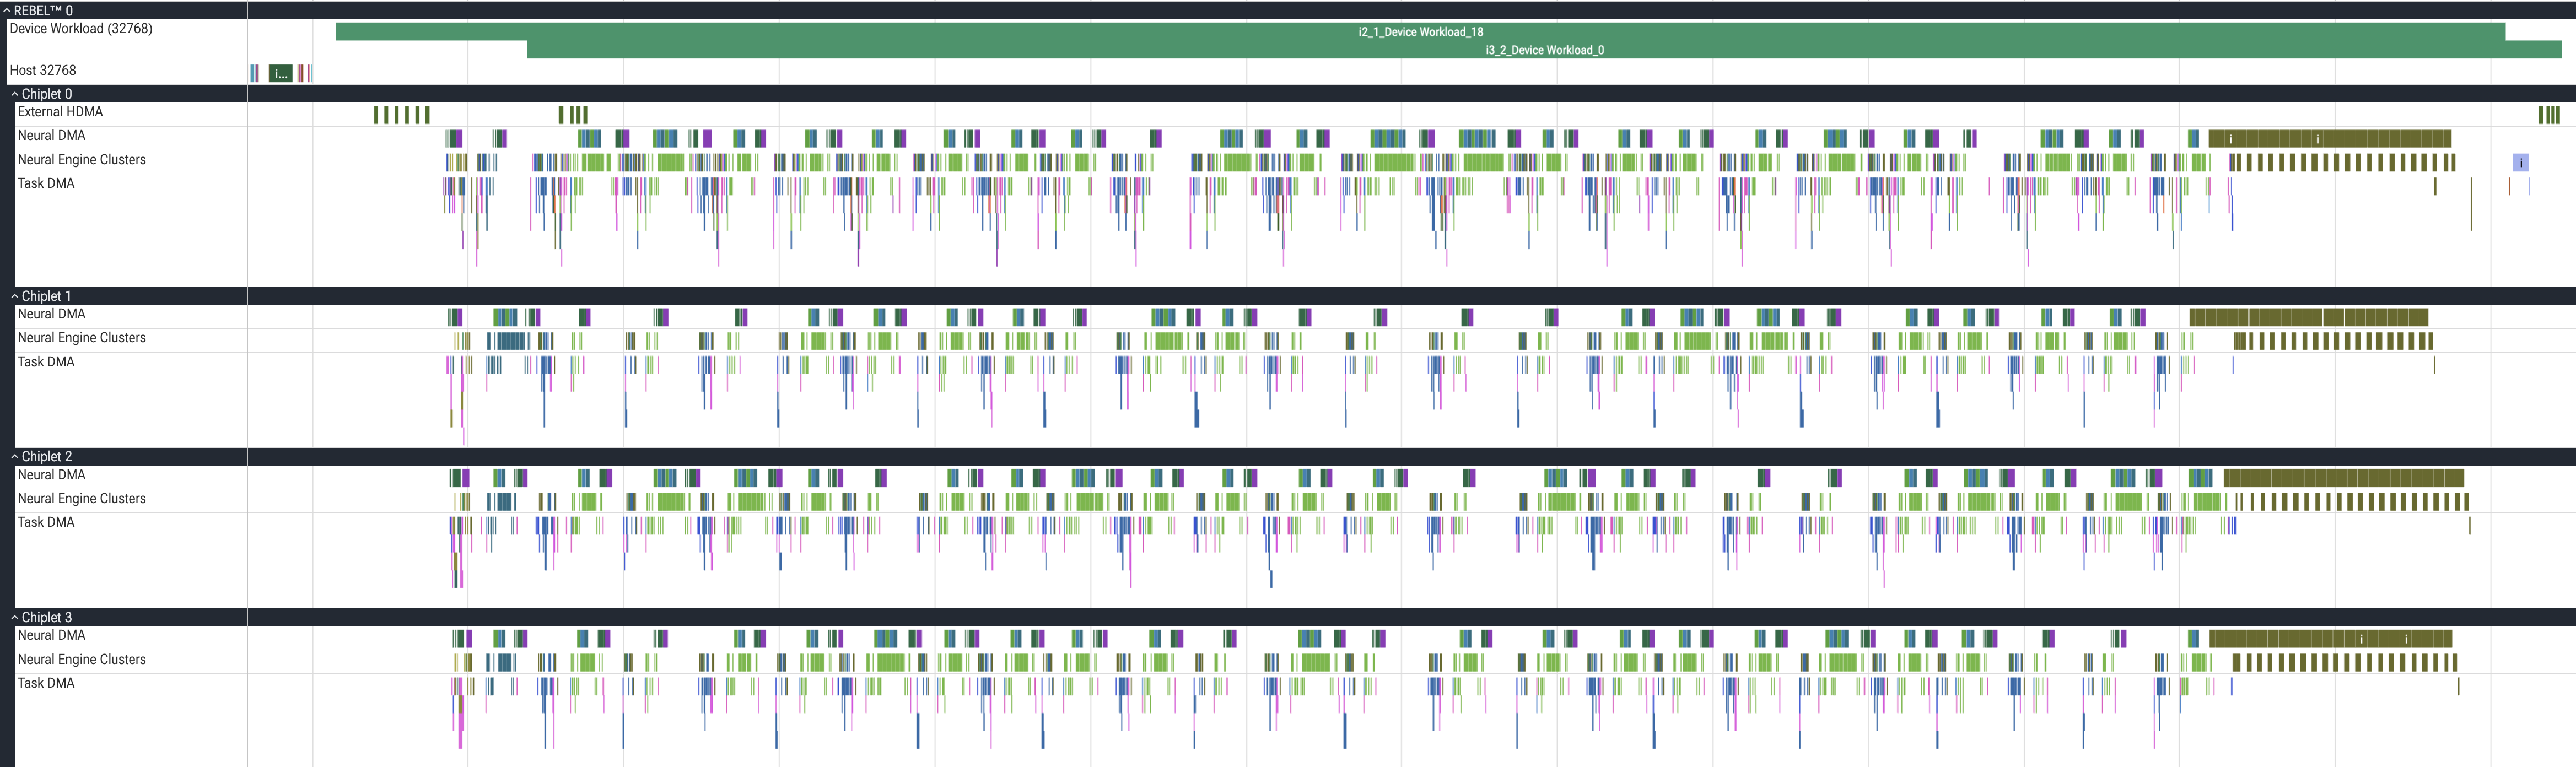
One decode step splits into executions of distinct compiled models — the decoder and the sampler — each leaving its own slice on the Device Workload track. The slice and command names identify the model associated with each execution; the naming convention is described in How to Analyze.
Commands of one execution carry the same W{workload_index} token in their names. Read the token from the slice's workload_index and search the trace for it to collect the commands that execution ran on each of the four chiplets.
Because the framework dispatches these executions asynchronously, their slices do not necessarily lie strictly one after another. When operations execute asynchronously or concurrently, their slices overlap in time, and Perfetto keeps such overlapping slices on one track and stacks them vertically, so the Device Workload track expands into several rows.
The two stacked slices in the screenshot are an example. The upper one, i2_1_Device Workload_18, is the decoder's execution, and the lower one, i3_2_Device Workload_0, is the sampler's. The sampler's slice starts while the decoder is still running.
The two are dispatched back to back. Early in the sampler's slice, the External HDMA that brings its input in runs first, and the computation on Neural Engine Clusters can be seen starting only after the decoder's commands have all finished.
PyTorch Profiler Integration
Info
This integration needs torch-rbln. Without it, the chrometrace the PyTorch profiler writes holds the PyTorch framework operations alone.
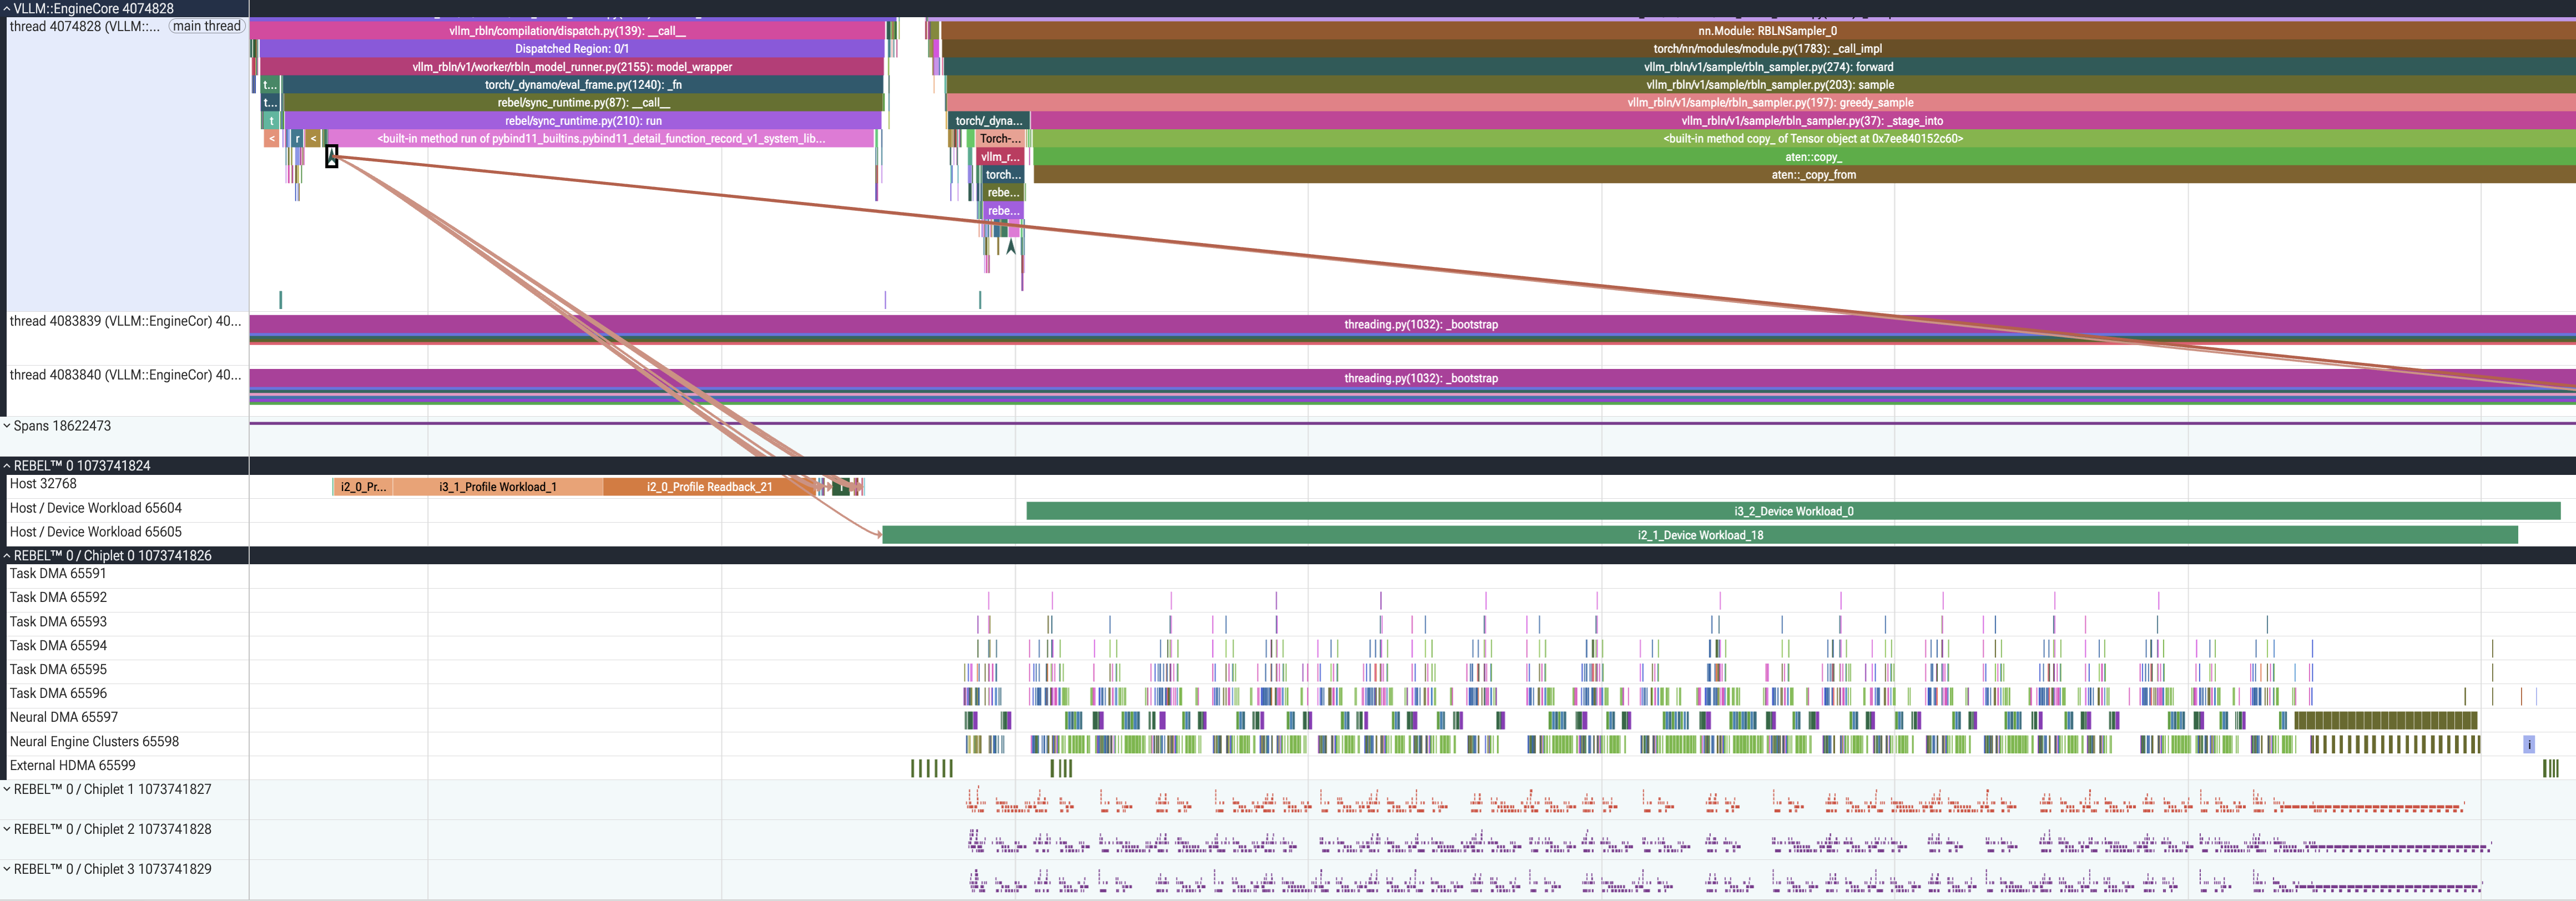
With the PyTorch profiler enabled as well, the framework operations and the device execution land in one chrometrace. Where the runtime dispatches device work asynchronously, though, the device work does not necessarily fall inside the wall-clock window of the function that launched it — and time alone is then not enough to tell which operation caused which device work.
launch_id is what ties the two levels together in that case. An rbln_run slice marks the point on the host where a runtime call begins, and every device slice that call produced carries the same launch_id. Perfetto draws that correspondence as flow arrows, so selecting a device slice leads back to the host call that launched it even when the two do not overlap in time, and the same arrows can be followed in the other direction.
References
- RBLN Profiler
- Analyzing profiler data with Perfetto
- Other profiling examples: Qwen3-1.7B (Text Generation), gpt-oss-20b (Data Parallelism)